


Sand (API)
The p-y curve for sands according to API is shown in Figure 1.
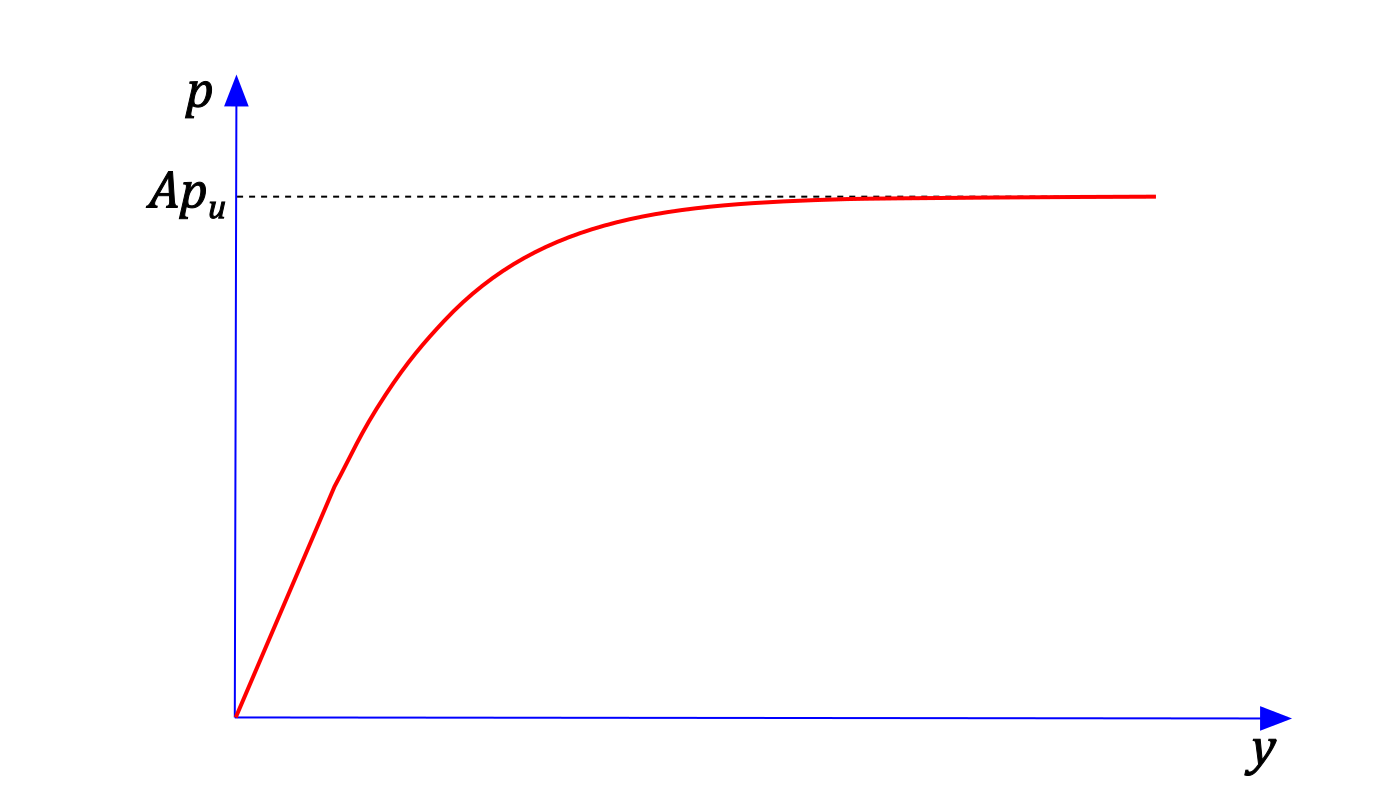 Figure 1: p-y curve for sand (API)
The input parameters for determining the curve are:
d [m] | – | pile diameter |
z [m] | – | depth below the ground surface |
γ [kN/m3] | – | unit weight of the soil |
φef | – | effective angle of internal friction of the soil |
k [MN/m3] | – | initial soil stiffness |
The relationship between displacement and soil resistance is nonlinear, and the factor A distinguishes between static and cyclic loading.
To determine the shape of the p-y curve, the coefficients C1, C2, and C3, which depend on the angle of internal friction, are calculated first:



where

The ultimate soil resistance pu is then taken as the smaller of the values pus and pud, where pus is the ultimate soil resistance at shallow depth and pud is the ultimate soil resistance at great depth.

The resulting shape of the p-y curve is derived from the ultimate soil resistance pu as follows:
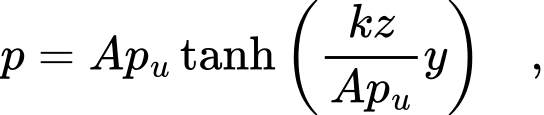
where A is a factor accounting for the type of loading, which takes the value Ac for cyclic loading and As for static loading:
