


Barton-Bandis
Similar to intact rock, rock joints exhibit nonlinear shear behavior over a wide range of confining pressures. This nonlinearity is reflected not only in the shear stress–displacement relationship but also in the shear strength envelope, as schematically illustrated in the following figure.
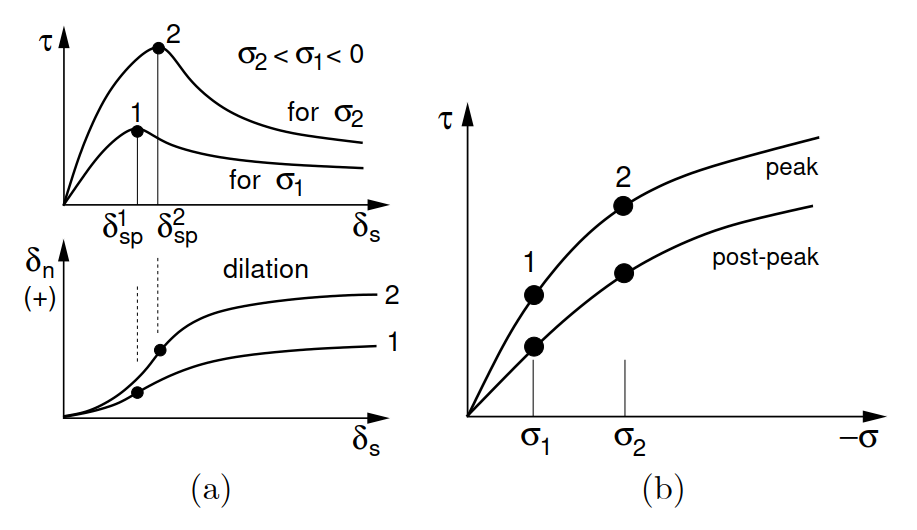 a) Shear stress–displacement and dilation diagrams, b) Shear strength envelope
For rough joints, the Barton–Bandis (BB) empirical model is among the most widely used failure criteria [1–6]. Its main advantage lies in the relatively straightforward determination of the required model parameters, which have clear physical interpretations [1, 2], as listed in the following table.
Symbol | Units | Description | |
φb | [°] | Basic friction angle | |
JRCp0 | [-] | Peak joint rougness coefficient measured for L0 | |
JCS0 | [MPa] | Join wall compressive strength measured for L0 | |
σc | [MPa] | Uniaxial compressive strength of the rock | |
L0 | [m] | Length of joint to measure JRCp0, JCS0 (lab-scale) | |
Ln | [m] | Length of joint of interest (in situ scale) | |
r | [-] | Schmidt rebound number on wet and weathered surface | |
R | [-] | Schmidt rebound number on dry and unweathered surface | |
A, B, C, D | [-] | Model parameters to define δeln,max | |
φr | [°] | Residual friction angle (calculated) | |
δsp | [m] | Peak value of relative displacement along joint (calculated) | |
JRCp | [-] | Size dependent value of JRCp0 (calculated) | |
JCS | [MPa] | Size dependent value of JCS0 (calculated) | |
Kni | [GN/m3] | Initial value of normal stiffness (calculated) | |
aj | [mm] | Initial (unstressed) joint aperture (calculated) | |
δeln,max < 0 | [mm] | Maximum normal joint closure in pure compression (calculated) |
Another key advantage of the BB model is its ability to reproduce experimentally observed dilation and post-peak strain softening. To capture these features, the nonlinear failure criterion incorporates the mobilized joint roughness coefficient JRCm. The following figure illustrates the evolution of JRCm as a function of relative shear displacement δs for a simulated direct shear test.
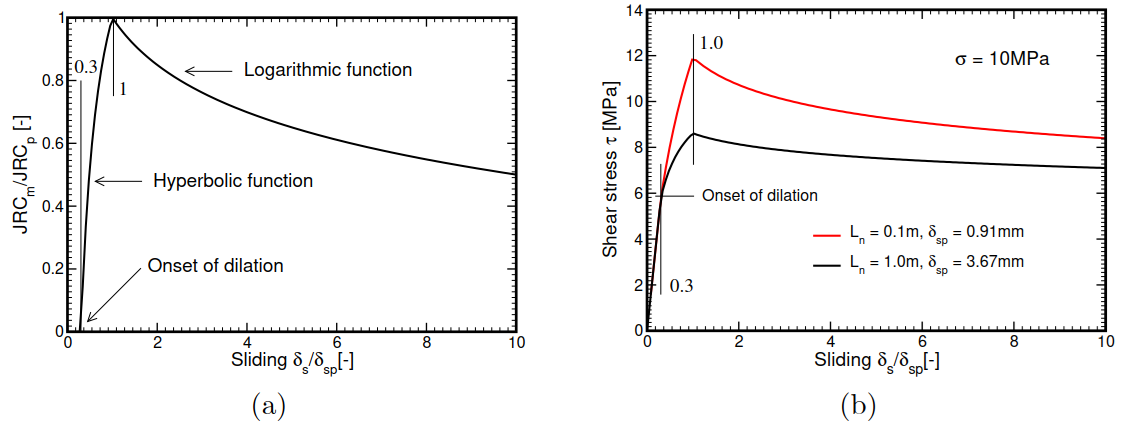 a) Concept of joint roughness mobilization [6], b) Evolution of shear stress: testing influence of joint size
It is seen that JRCm starst to evolve at the onset of dilation and reaches its peak value JRCp at δs = δsp where

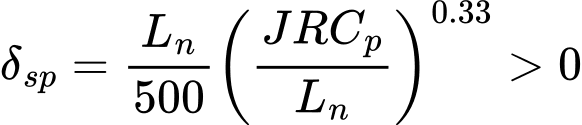
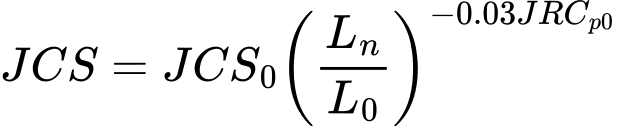
are adjusted according to the ratio between the in situ joint length Ln and the joint length L0 used in laboratory measurements. The resulting joint response for different joint sizes is also illustrated. Note that, prior to the onset of dilation, the shear response is governed by the elastic shear stiffness Ks. In GEO5 FEM, Ks can either be prescribed and, similarly to the Mohr–Coulomb interface model, kept constant throughout the simulation, or calculated as a function of the evolving normal compressive stress σ as follows
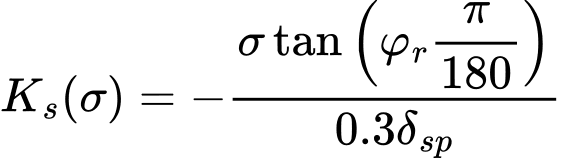
where the residual friction angle φr is given by

Similarly to Ks(σ), the mobilized value of the dilatancy angle ψ(σ) is a function of the current compressive normal stress written as

where the compressive joint wall strength JCS is also size dependent
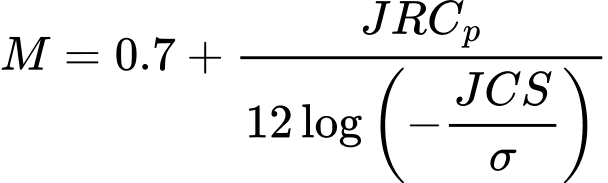
The joint damage coefficient M reads
Nonlinear elastic response in compression. In addition to linear elastic behavior characterized by a prescribed normal stiffness Kn GEO5 FEM allows the experimentally observed nonlinear elastic response of joints in the normal direction to be described using the following hyperbolic equation

where δn represents the crack closure. The equation implies that, as the normal compressive stress σ becomes very large, the ratio a/b approaches the limiting value δeln,max < 0, at which the normal jointstiffness Kn tends to infinity. A schematic representation of the joint response under compression is provided in the following figure.
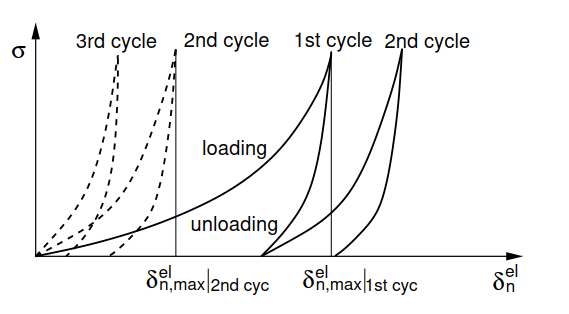 Nonlinear elastic response in compression associated with a given loading cycle
Derivation provided in the Theoretical manual gives the instantaneous normal stiffness Kn(σ) in the form
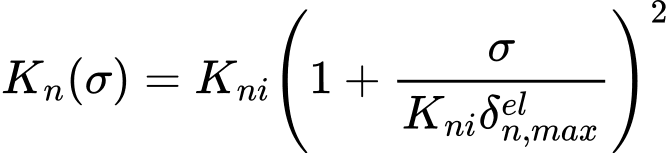
Because δeln,max < 0, it is clear that Kn(σ) increases with increasing compressive stress σ < 0. The initial normal stiffness Kni and δeln,max can be estimated using the following empirical relations


where aj is the initial joint aperture in [mm] and σc is the uniaxial compressive strength of the rock. The limiting value of the joint closure δeln,max in [mm] was suggested in the form

The dependence of the parameters A, B, C, and D on the loading cycle complicates their implementation in numerical models. The following table summarizes the values of these parameters derived in [3].
Parameter | 1st cycle | 2nd cycle | 3rd cycle |
A | 0,2960 ± 0,1258 | 0.1005 ± 0.0530 | 0.1032 ± 0.0680 |
B | 0.0056 ± 0.0022 | 0.0073 ± 0.0031 | 0.0074 ± 0.0039 |
C | 2.2410 ± 0.3504 | 1.0082 ± 0.2351 | 1.1350 ± 0.3261 |
D | -0.2450 ± 0.1086 | -0.2301 ± 0.1171 | -0.2510 ± 0.1029 |
A key limitation of the present formulation is that the compressive response is assumed to be purely nonlinear elastic, with no permanent compressive displacement upon unloading. Consequently, the experimentally observed unloading path shown in the previous figure is not captured. Instead, the stress path during loading, unloading, and reloading follows the initial loading curve defined by the parameter values listed in the preceding table, see the next figure (a). Furthermore, the formulation does not account for the reduction in normal stiffness that can occur in dislocated joints as a result of dilation during shearing.
The following figure illustrates the evolution of normal stiffness with increasing normal compressive stress, highlighting the effects of both the loading cycle and joint size.
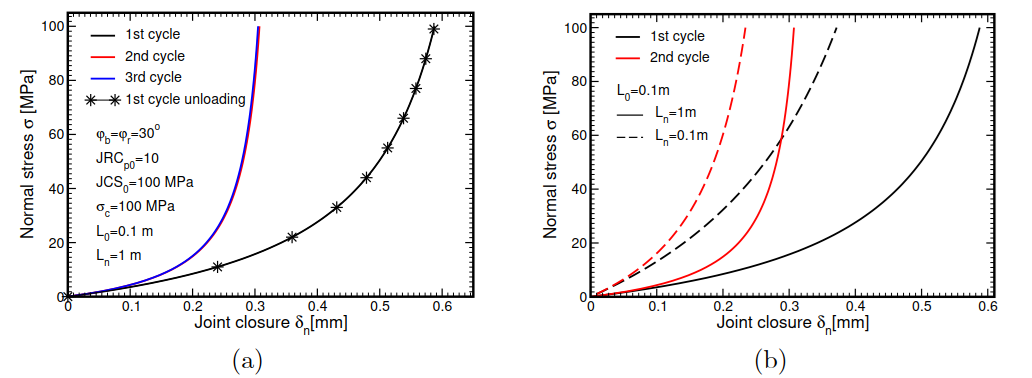 Evolution of joint closure with gradual increase of stress: a) influence of loading cycle, b) influence of joint size
Details on numerical implementation can be found in the Theoretical manual.
[1] N. Barton and V. Choubey. The shear strength of rock joints in theory and practice. Rock Mechanics, 10:1–54, 1977.
[2] S.C. Bandis, A.C. Lumsden, and N.R. Barton. Experimental studies of scale effects on the shear behaviour of rock joints. International Journal of Rock Mechanics and Mining Sciences & Geomechanics Abstracts, 18(1):1–21, 1981.
[3] S.C. Bandis, A.C. Lumsden, and N.R. Barton. Fundamentals of Rock Joint Deformation. International Journal of Rock Mechanics and Mining Sciences & Geomechanics Abstracts, 20(6):249–268, 1983.
[4] N. Barton, S. Bandis, and K. Bakhtar. Strength, Deformation and Conductivity Coupling of Rock Joints. International Journal of Rock Mechanics and Mining Sciences & Geomechanics Abstracts, 22(3):121–140, 1985.
[5] N. Barton. Shear strength criteria for rock, rock joints, rockfill and rock masses: Problems and some solutions. Journal of Rock Mechanics and Geotechnical Engineering, 5:249–261, 2013.
[6] S.H. Prassetyo, M. Gutierrez, and N. Barton. Nonlinear shear behavior of rock joints using a linarized implementation of the Barton-Bandis model. Journal of Rock Mechanics and Geotechnical Engineering, 9:671–682, 2017.